An Introduction to Molecular Graphics
Explore the captivating world of molecular graphics, where science meets art to unravel the secrets of molecules. From the early days of wooden models to the digital age, this journey delves into the history, diverse visualization techniques, and the intricate representations of atoms, proteins, surfaces, and nucleic acids. Join us as we decipher the language of molecular visualization.
Learning Objectives
At the end of this lesson, you should be able to:
- Understand the evolution of molecular graphics and its core principles.
- Differentiate wireframe, ball-and-stick, and space-filling atomic models.
- Recognize limitations of space-filling models and appreciate the advantages of ribbon diagrams.
- Identify and analyze diverse molecular surfaces.
- Explore different nucleic acid visualization techniques.
1. Definition
Molecular graphics is the field of study that focuses on understanding molecules and their properties using visual representations, like pictures, diagrams and interactive models. It involves creating images and visual models to explore and explain how molecules are structured and what makes them unique, helping scientists and researchers better comprehend the world of chemistry and biology.
The IUPAC’s Glossary of Terms Used in Computational Drug Design describes molecular graphics as a technique for visualizing and manipulating molecules on a graphical display device. This definition imposes limitations on molecular graphics by confining it to electronic or digital devices like computer monitors, television screens, mobile phones, and tablets.
Molecular graphics doesn’t always require a digital screen. Its origins lie in early methods like paper sketches and physical models crafted from wood or plastic. Diverse techniques like bead models, lego models and 3D printing provide engaging alternatives for comprehending molecules, without reliance on graphical display devices.
2. History
Molecular graphics with physical models and paper began in the late 19th century with the work of chemists like Alexander Crum Brown. They used wooden or cardboard balls and sticks to create rudimentary representations of molecular structures, pioneering the ball-and-stick model. These models allowed scientists to visualize and communicate molecular geometries, aiding early developments in structural chemistry.
The first attempts to build scaled molecular models started with X-ray diffraction studies. In the early days of X-ray crystallography, researchers were primarily focused on determining the arrangement of atoms within these molecules rather than creating detailed miniature models of them. The main goal of diffraction studies was to uncover the intricate molecular structures.
Once scientists obtained precise atomic coordinates through these studies, they could create symbolic, yet accurate, molecular models to scale. These models served as visual representations of the real molecules and were often captured in photographs for use in scientific writings and presentations.
A significant turning point in the field took place in 1953 when researchers Robert Corey and Linus Pauling created exceptionally precise scaled models. These models were instrumental in studying the structures of amino acids, peptides, and proteins. Crafted from sturdy hardwood, these models were meticulously built to a specific scale: 1 inch on the model equaled 1 angstrom (Å) in reality. Corey and his collegues used clamping devices to connect the individual components, ensuring the models maintained the desired molecular configurations.
In the mid-1960s, the field of crystallography underwent a transformation with the introduction of digital computers, which could now be harnessed to carry out extensive calculations. Project MAC (Machine-Aided Cognition) at MIT made early attempts to simulate molecules, marking the first instance of computer-generated wireframe models being displayed on a cathode ray tube. A group of researchers at MIT, led by Cyrus Levinthal, used one of the first interactive computer screens to visualize and analyze the shapes of proteins and DNA. This pioneering work by Cyrus Levinthal and his team at MIT laid the foundation for contemporary interactive molecular graphics.
3. Atomic Structures
How we portray atoms in molecules depends on whether we want to emphasize their bonds or the shapes of the molecules.
To represent bonds, we use either wireframe or ball-and-stick models. When we want to focus on the overall shape of molecules, we create space-filling models. A well-known method for this is the Corey-Pauling-Koltun (CPK) model, which involves assembling spheres that interlock. In this CPK model, each sphere represents a specific atom and is colored to match the element it represents (such as black for carbon, white for hydrogen, red for oxygen, and blue for nitrogen). The sphere’s size, typically around 0.5 inches per angstrom (Å), reflects the Van der Waals radius of the corresponding atom.
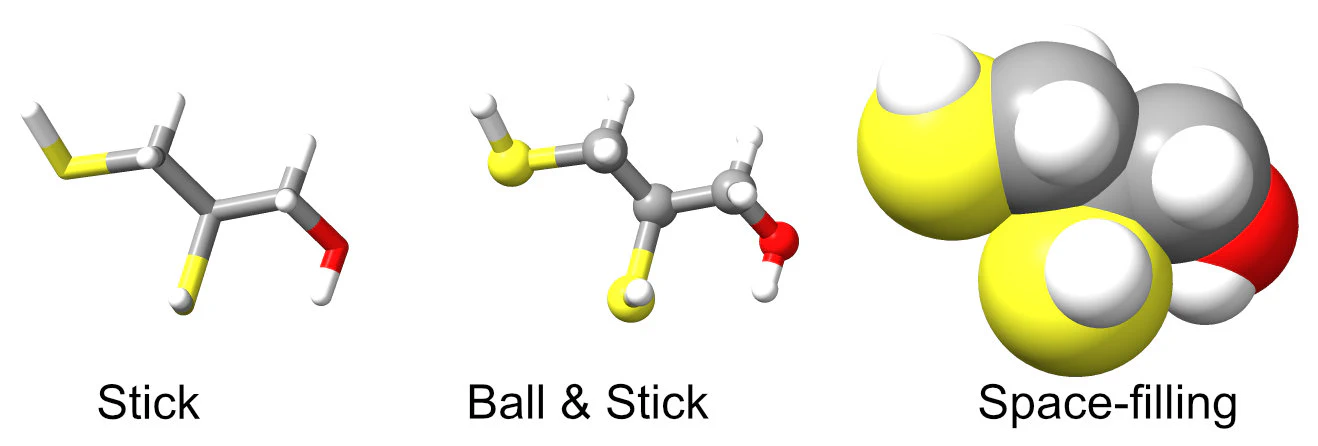
In the early days, wireframes and ball-and-stick models were crafted using materials like wire and spheres made from wood, metal, or plastic. Space-filling models were assembled by connecting plastic spheres to one another using snap fasteners.
It’s interesting to note that all the atomic visualizations we use today are essentially digital versions of these early models, which were originally constructed using wires, wood, and plastic.
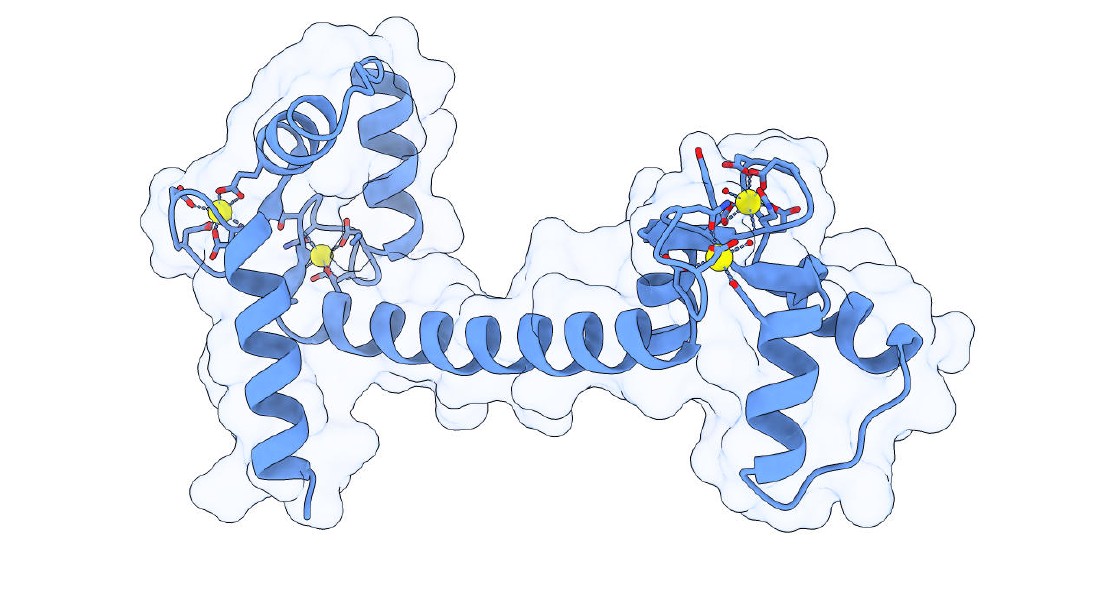
4. Secondary Structural Elements in Proteins
The primary objective of the seminal study, published by Robert Corey and Linus Pauling in 1953, was to visualize amino acids and proteins. In fact, their journal article was also titled ‘Molecular Models of Amino Acids, Peptides, and Proteins’.
Corey and Pauling’s space-filling model, though revolutionary in depicting the three-dimensional structure of proteins, faced constraints when visualizing secondary structural elements. Secondary structure refers to the local folded arrangements of a polypeptide chain, primarily characterized by alpha helices and beta sheets.
The space-filling model, depicting atoms as spheres, may obscure the unique features of secondary structures because of its detailed representation of the molecular surface. This hampers the clear observation of finer details, such as helical or sheet-like features, impeding a full comprehension of a protein’s architecture. Additionally, the model might not adequately display the sequential order and connections between amino acids.
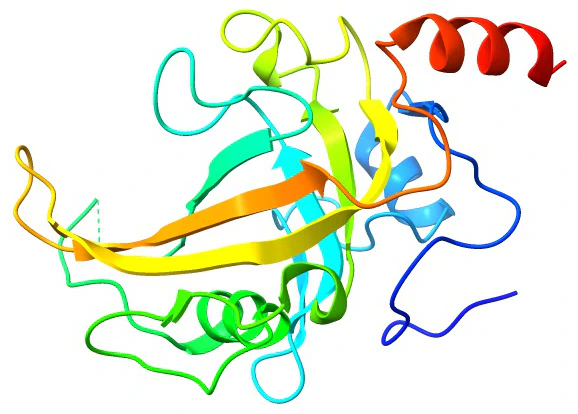
Some of the weaknesses in the CPK model in visualizing secondary structural elements were addressed by the ribbon diagrams developed by Jane Richardson in the 1980s (The Anatomy and Taxonomy of Protein Structure - Jane Richardson). Richardson diagrams, also known as ribbon or cartoon diagrams, provide a clear and intuitive depiction of a protein’s three-dimensional structure. In a Richardson diagram, the polypeptide chain is represented as a ribbon, with helices shown as spirals and beta-strands as arrows. The use of color and thickness variations in the ribbon allows for the highlighting of specific structural features, such as alpha helices, beta sheets, turns, and loops. This visualization method aids researchers in understanding the overall architecture of a protein, facilitating the identification of key structural motifs and their relationships.
5. Molecular Surfaces
The molecular surface refers to the theoretical boundary that defines the spatial extent of a molecule in three-dimensional space.
The CPK model, which employs color-coded spheres to symbolize different atoms in a molecule, has several limitations when it comes to representing molecular surfaces in detail. One major drawback is its use of fixed atomic radii, which fails to account for variations influenced by chemical bonding and environmental factors. The model lacks the capability to accurately depict the intricacies of molecular surfaces, such as the presence of concave or convex regions. Additionally, the CPK model is static and does not provide dynamic information about molecular interactions, solvent accessibility, or electrostatic properties.
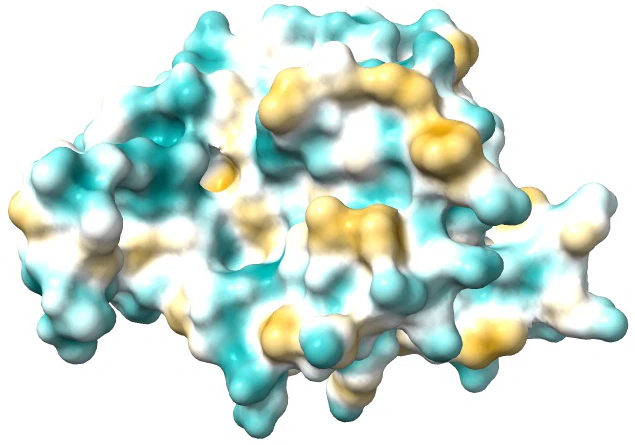
There are three main types of molecular surfaces. They play pivotal roles in understanding the structure and interactions of molecules. The Van der Waals surface, representing the outer boundary based on atom Van der Waals radii, provides insights into molecular volume and shape. The solvent-accessible surface (SAS) considers the area accessible to solvent molecules as they roll over the Van der Waals surface, offering information on molecular interactions with solvents. The solvent-excluded surface (SES), conversely, defines the region inaccessible to solvent molecules. Beyond these, various derived molecular surfaces enhance our understanding of molecular properties.
| Surface Type | Description |
|---|---|
| Van der Waals Surface | Represents the outer boundary of a molecule based on the Van der Waals radii of its atoms |
| Solvent-Accessible Surface (SAS) | Represents the area of a molecule accessible to a solvent molecule as it rolls over the van der Waals surface |
| Solvent-Excluded Surface (SES) | Represents the region of a molecule inaccessible to a solvent molecule |
| Molecular Orbital Surface | Visualizes regions in a molecule where electrons are likely to be found, providing insights into electronic structure and bonding |
| Electrostatic Potential Surface | Represents the distribution of electrostatic potential on the molecular surface, aiding in understanding charge distribution and chemical reactivity |
| Hydrophobic and Hydrophilic Surfaces | Highlights water-repelling (hydrophobic) or water-attracting (hydrophilic) regions within a molecule |
| Pocket and Cavity Surfaces | Highlight pockets or cavities within a molecule, essential in drug design and molecular docking studies for identifying potential binding sites |
6. Nucleic Acids
Limitations arise when employing molecular graphics intended for proteins in the visualization of nucleotides. Nucleic acids exhibit unique features such as base pairing and sugar-phosphate backbones, distinguishing them from proteins. Traditional protein-centric tools, like ribbon diagrams, may not proficiently convey these aspects of nucleic acid structures. Therefore, specialized visualization methods tailored for nucleotides are essential to accurately represent their distinctive features.
These specialized visualization techniques can be categorized into three groups:
- Backbone visualization techniques,
- Sugar visualization techniques, and
- Base pair visualization techniques.
6.1 Backbone Visualization Techniques
The ribbon representation employed for proteins can be refined to improve the accuracy of depicting the nucleic acid backbone. This refinement involves rotating the ribbon axis by 90 degrees, ensuring that the resulting backbone ribbon is perpendicular to the bases. This adjustment aims to offer a more realistic portrayal of the nucleic acid backbone structure.
6.2 Sugar Visualization Techniques
The sugar in nucleotides features a five-membered furanose ring structure. The term “pucker” describes the distortion or bending of this ring, leading to different conformations known as sugar puckers. In nucleic acids, the furanose ring commonly adopts either the envelope form, involving four atoms in a plane, or the twist form, with three atoms in a plane and two adjacent atoms on either side of that plane. The sugar pucker can be clarified by depicting either two planes (envelope form) or four planes (twist form). Another representation of the sugar is as a tube connecting the base to the backbone atoms or ribbon. This tube is drawn from the C4′ atom of the sugar to the N1 atom of the base for pyrimidines or N9 for purines.
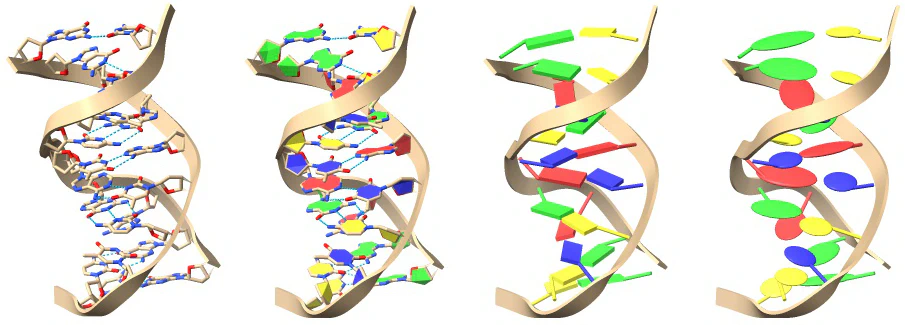
6.3 Base Pair Visualization Techniques
Various visual representations of bases can be employed to highlight essential structural features, such as base stacking. Bases may take on different forms, including filled bases, box slabs (or boxes), elliptical tube slabs, or ellipsoid slabs. The filled base option involves filling the rings of pyrimidines and purines, preserving the identity of the base as purine or pyrimidine while enhancing the visibility of the rings. The slab options are crafted to underscore base pairing and stacking, with the box formation particularly emphasizing the helical quality akin to a ‘spiral staircase.’ Platter-like ellipsoids and elliptical tubes possess elliptical cross-sections along the axis of the π-orbitals of the bases, presenting an abstraction where rings appear as squares or rectangles.
7. Final Thoughts
Exploring molecular graphics unveils its evolution from basic wooden models to today’s digital realm. This journey traverses history, detailing diverse visualization methods for atoms, proteins, surfaces, and nucleic acids. Beyond historical milestones, we find that molecular graphics isn’t confined to digital screens, originating from tangible forms like wooden and bead models.
Analyzing atomic structures reveals the progression from wireframes to space-filling models, acknowledging limitations and solutions, such as ribbon diagrams for proteins. Nucleic acids demand specialized techniques. From refined ribbons to sugar pucker depictions and varied base representations, these techniques enrich comprehension.
To sum up, our exploration uncovers the practical side of molecular graphics, highlighting its adaptability, historical origins, and real-world importance. It’s a journey through both physical and digital realms, making the complex language of molecular structures clear and practical.
Related Posts
ChimeraX Matchmaker
Dive into the world of “Matchmaker”, an essential ChimeraX extension for protein structure-function research. This blog post unveils its intricacies, guiding you through both its fundamentals and advanced features.
Read more
Navigating PDB: Legacy Format to PDBx/mmCIF
Discover the fascinating journey of protein data storage since 1971. From the legacy PDB format, designed for punched cards, to the modern PDBx/mmCIF format, built to accommodate complex macromolecular data.
Read more
ChimeraX Command Line Interface (CLI)
Discover the capabilities of ChimeraX’s Command Line Interface (CLI) for seamless control of its numerous functions. Gain proficiency in accessing the CLI, browsing through command history, and harnessing the flexible “open” command for handling both local and online data.
Read more