Navigating PDB: Legacy Format to PDBx/mmCIF
Discover the fascinating journey of protein data storage since 1971. From the legacy PDB format, designed for punched cards, to the modern PDBx/mmCIF format, built to accommodate complex macromolecular data. Dive into the evolution of the Protein Data Bank (PDB) and its pivotal role in structural biology.
Learning Objectives
At the end of this lesson, you should be able to:
- Gain an understanding of the historical context and the significant impact of the Protein Data Bank (PDB) in the field
- Explore the complexities of the traditional PDB file structure
- Acquire a basic understanding of the mmCIF file format
1. Protein Data Bank
The Protein Data Bank (PDB) was established at Brookhaven National Laboratory in 1971 to archive macromolecular structural data. The Worldwide PDB (wwPDB) is the organization responsible for managing the PDB archive. The wwPDB was founded in 2003 by the Research Collaboratory for Structural Bioinformatics (RCSB), the Macromolecular Structure Database (MSD) at the European Bioinformatics Institute (EBI), and the Protein Data Bank Japan (PDBj) at the Institute for Protein Research at Osaka University.
As of this writing, the Worldwide PDB (wwPDB) comprises five members: RCSB, PDBj, Protein Databank in Europe (PDBe), Biological Magnetic Resonance Database (BMRB), and Electron Microscopy Databank (EMDB). The RCSB, which operates its data centers from the USA, serves as the archive keeper of the database. It is responsible for issuing new PDB IDs and maintaining a single version of the database.
The PDB archive contains more than 1 TB of structural data, stored in two text-based flat file formats: the legacy PDB format and the new PDBx/mmCIF (macromolecular Crystallographic Information File) format. The estimated cost of replicating the PDB database is 18 billion USD. The PDB database grows at a rate of 10% per year and has contributed to more than 1 million journal articles thus far.
2. Legacy PDB Format
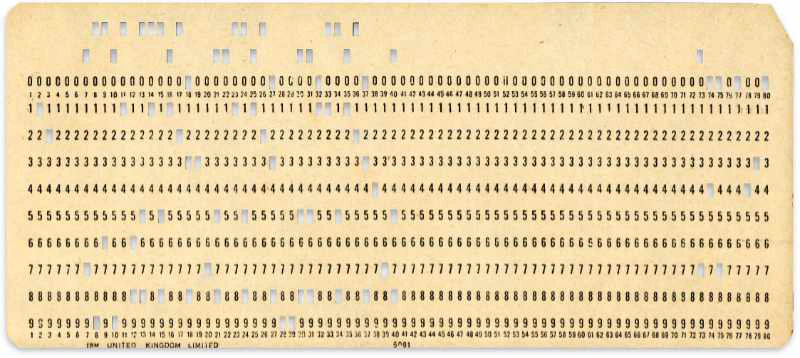
The PDB file format, sometimes called legacy PDB format was created in 1971 with the establishment of the PDB. This file format was designed to use 80 columns of the punched cards available at the time. A punched card is a piece of hard paper that holds digital data represented by the presence or absence of holes in predefined positions. These cards were in use until the mid-1970s.
As of September 21, 2023, the largest PDB file in terms of file size was an ensemble model for Escherichia coli dihydrofolate reductase (PDB ID: 4PTH). If we were to store this 108 MB file using 1970s punched cards, the weight of the cards would be roughly 3560 kg.
The legacy PDB format specified fixed column positions and column widths for all data items. A single row of a PDB file can carry up to 80 characters. During the early days of the PDB, storing a single line required a separate punched card. Each line in the PDB file starts with a self-identifying record name and ends with an end-of-line character. The first 6 characters (or columns) in each line are reserved for the record name. PDB records can span one or more lines. Each record is further divided into fields.
PDB records contain data such as molecule names, primary and secondary structure information, sequence database references, atomic coordinates, crystallographic structure factors, and bibliographic citations, among other details. Related PDB records can be grouped into 10 distinct sections as follows:
- Title Section - Records describing molecules and experiments
- Primary Structure Section - Sequence of residues in different chains of the macromolecule
- Heterogen Section - Records describing non-standard residues
- Secondary Structure Section - Describes helices and sheets found in proteins
- Connectivity Annotation Section - Describes connectivity between residues not implied by the primary structure (disulfide bonds, prolines, etc.)
- Miscellaneous Features Section - Describes details such as environments surrounding non-standard residues or the assembly of an active site
- Crystallographic and Coordinate Transformation Section - Describes the geometry of the crystallographic experiment and the coordinate system transformations
- Coordinate Section - Atomic coordinates and model records
- Connectivity Section - Information on atomic connectivity
- Bookkeeping Section - Bookkeeping information such as checksums and final record markings
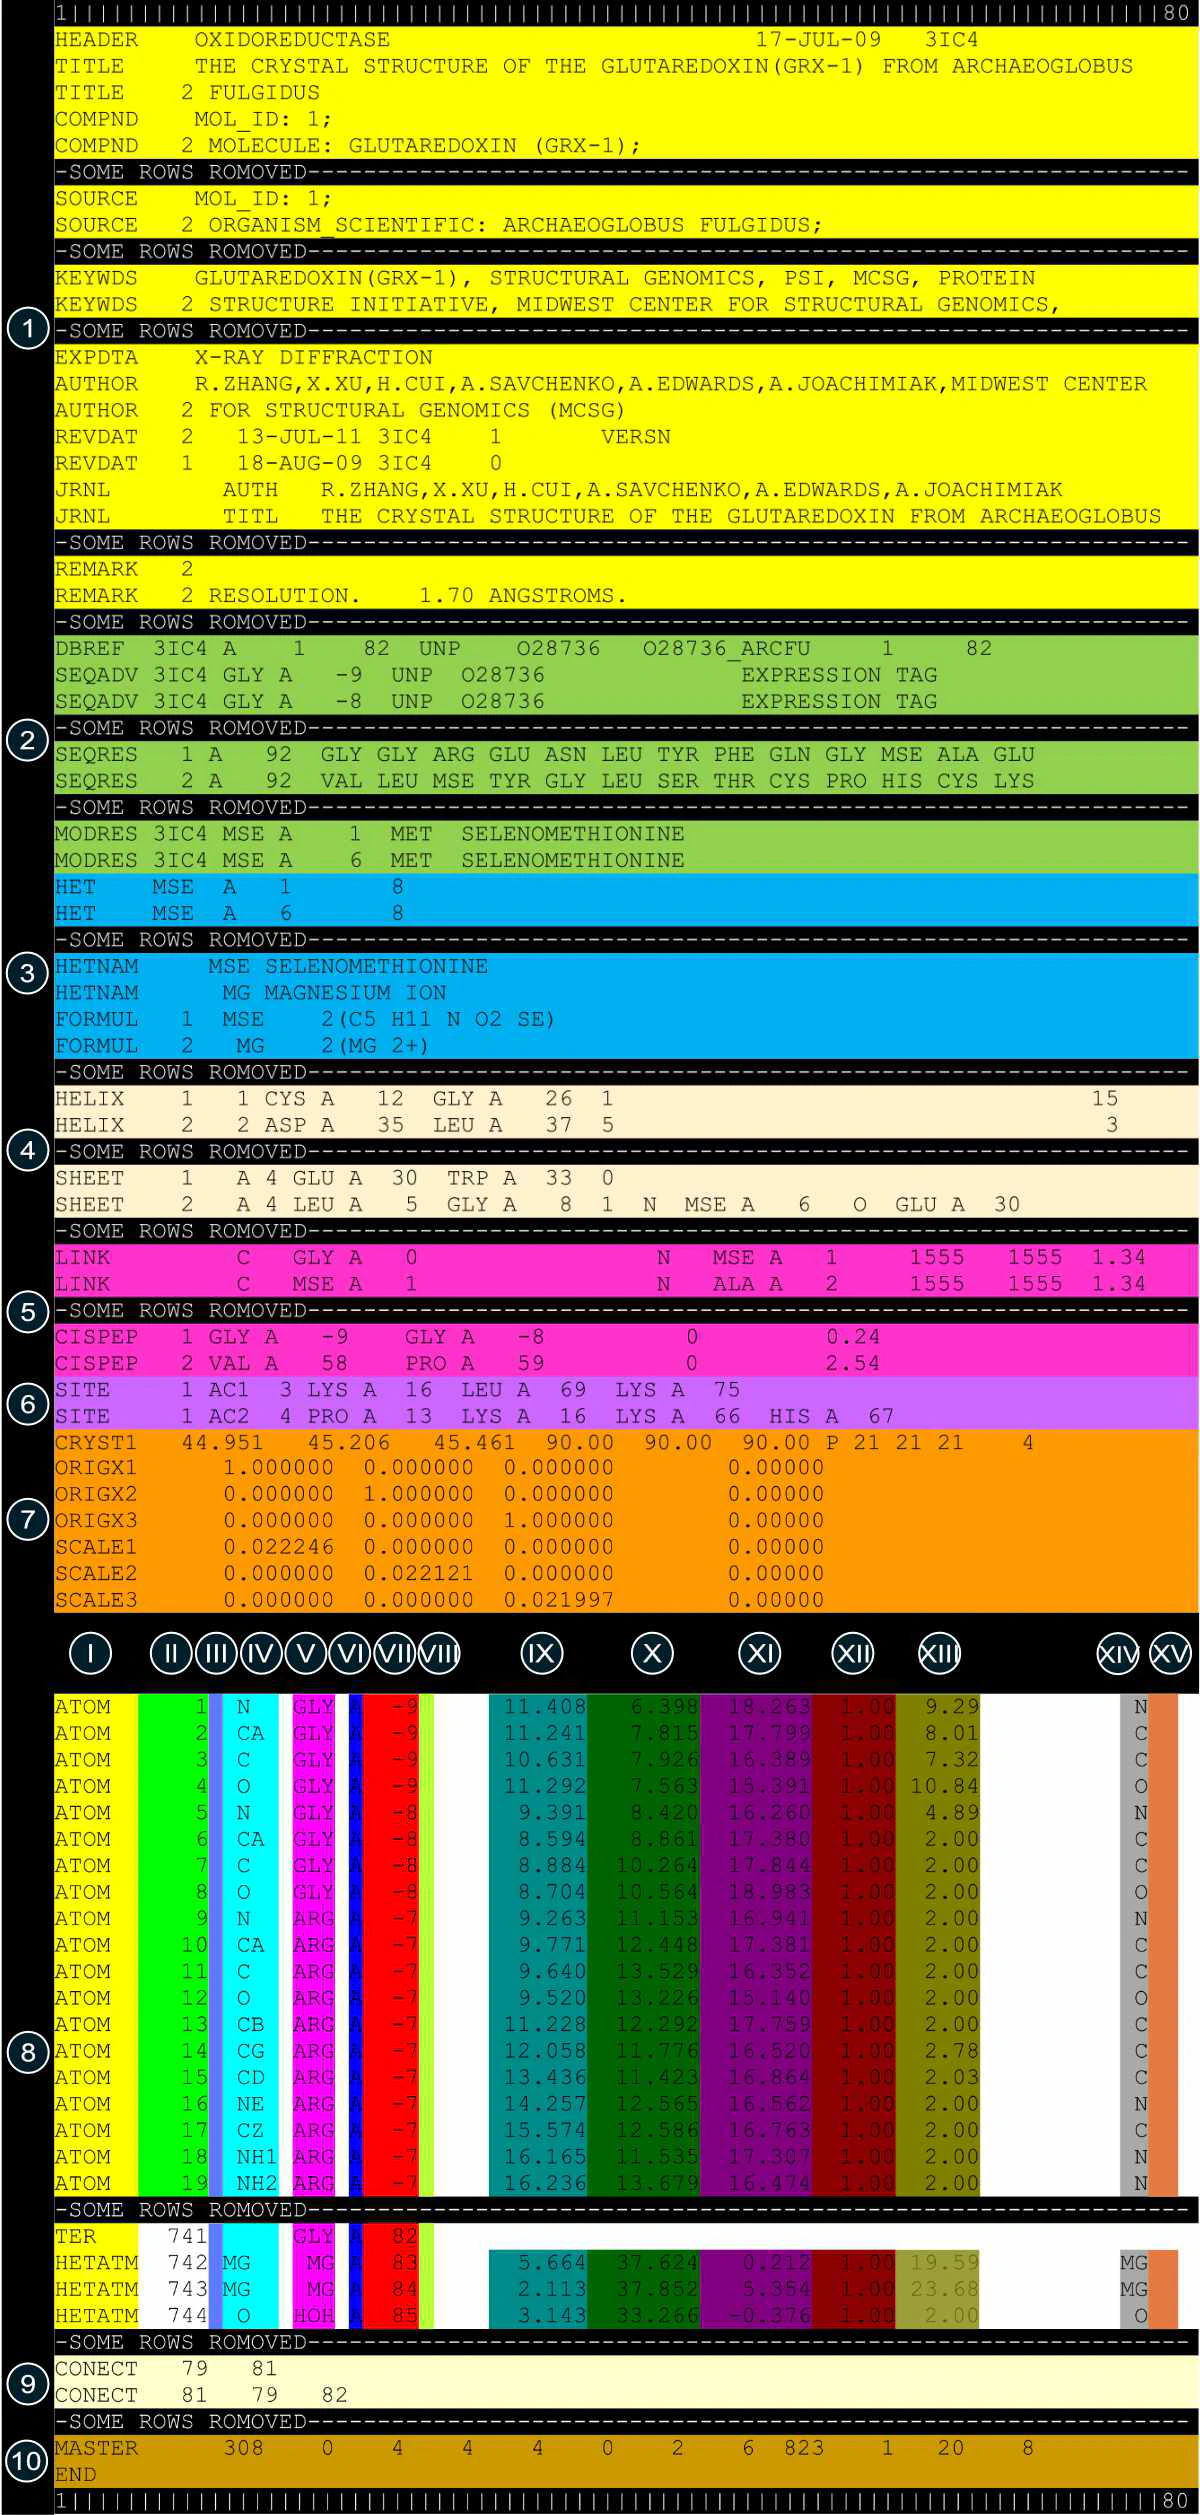
| Color Code | Columns | Definition |
|---|---|---|
| I | 1 - 6 | Record name |
| II | 7 - 11 | Atom serial number |
| III | 13 - 16 | Atom name |
| IV | 17 | Alternate location indicator |
| V | 18 - 20 | Residue name |
| VI | 22 | Chain identifier |
| VII | 23 - 26 | Residue sequence number |
| VIII | 27 | Code for insertion of residues |
| IX | 31 - 38 | Orthogonal coordinates for X in Angstroms |
| X | 39 - 46 | Orthogonal coordinates for Y in Angstroms |
| XI | 47 - 54 | Orthogonal coordinates for Z in Angstroms |
| XII | 55 - 60 | Occupancy |
| XIII | 61 - 66 | Temperature factor |
| XIV | 77 - 78 | Element symbol, right-justified |
| XV | 79 - 80 | Charge on the atom |
The PDB format has specific constraints, such as an inability to accommodate over 62 chain identifiers or more than 99,999 atoms.
On July 1st, 2019, the PDB ceased to accept macromolecular structures in the legacy PDB format. Nevertheless, around 98% of macromolecular structures within the PDB database remain accessible in the legacy PDB format.
3. New PDBx/mmCIF Format
The PDBx/mmCIF file format is the sole format accepted by the wwPDB for depositing, annotating, and archiving macromolecular data. Originally, the CIF (Crystallographic Information File) format was created to archive data from small molecule crystallographic experiments. In 1997, it was expanded to encompass information pertaining to macromolecules, resulting in the mmCIF format. This revised format effectively addresses the constraints of the traditional PDB file format and accommodates data related to extensive structures, intricate chemistry, as well as innovative and hybrid experimental techniques.
The data items in mmCIF have names that begin with an underscore and consist of two parts: a category name and an attribute name, separated by a period. For instance, _citation.year is an example of such a name, and we refer to this combination of category and attribute as an mmCIF token.
Data categories can be presented in two ways: as key-value pairs or in a table-like (tabular) format.
In the key-value style, the mmCIF token is directly followed by its corresponding value. It’s like saying, ‘Here’s the category, and here’s its value.’
The following example shows the citation information extracted from PDB entry 1HWI.
_citation.id                        primary
_citation.title                     'Structural mechanism for statin inhibition of HMG-CoA reductase.'
_citation.journal_abbrev            Science
_citation.journal_volume            292
_citation.page_first                1160
_citation.page_last                 1164
_citation.year                      2001
The tabular style is employed when there are multiple values for each token. In this format, we start with a loop_ token, followed by a list of data item names and their corresponding data values separated by spaces. This format is useful when there is a need to present multiple pieces of information related to one token.
The following example shows the initial section of coordinate records extracted from PDB entry 1HWI. In this context, the _atom_site category is employed to detail the identities and atomic positions of the atoms within the entry.
loop_
_atom_site.group_PDB
_atom_site.id
_atom_site.type_symbol
_atom_site.label_atom_id
_atom_site.label_alt_id
_atom_site.label_comp_id
_atom_site.label_asym_id
_atom_site.label_entity_id
_atom_site.label_seq_id
_atom_site.pdbx_PDB_ins_code
_atom_site.Cartn_x
_atom_site.Cartn_y
_atom_site.Cartn_z
_atom_site.occupancy
_atom_site.B_iso_or_equiv
_atom_site.pdbx_formal_charge
_atom_site.auth_seq_id
_atom_site.auth_comp_id
_atom_site.auth_asym_id
_atom_site.auth_atom_id
_atom_site.pdbx_PDB_model_num
ATOM   1     N N     . LEU A 1 41  ? 1.318  -50.979 -4.600  1.00 56.33  ? 462  LEU A N     1
ATOM   2     C CA    . LEU A 1 41  ? 0.537  -49.714 -4.784  1.00 55.72  ? 462  LEU A CA    1
ATOM   3     C C     . LEU A 1 41  ? 1.176  -48.821 -5.845  1.00 54.46  ? 462  LEU A C     1
ATOM   4     O O     . LEU A 1 41  ? 2.399  -48.777 -5.972  1.00 53.28  ? 462  LEU A O     1
ATOM   5     C CB    . LEU A 1 41  ? 0.447  -48.936 -3.466  1.00 57.20  ? 462  LEU A CB    1
ATOM   6     C CG    . LEU A 1 41  ? -0.255 -49.536 -2.243  1.00 59.72  ? 462  LEU A CG    1
ATOM   7     C CD1   . LEU A 1 41  ? -0.041 -48.620 -1.047  1.00 60.47  ? 462  LEU A CD1   1
ATOM   8     C CD2   . LEU A 1 41  ? -1.749 -49.723 -2.506  1.00 61.89  ? 462  LEU A CD2   1
ATOM   9     N N     . SER A 1 42  ? 0.341  -48.127 -6.614  1.00 53.85  ? 463  SER A N     1
ATOM   10    C CA    . SER A 1 42  ? 0.821  -47.221 -7.653  1.00 54.22  ? 463  SER A CA    1
4. Final Thoughts
In tracing the captivating journey of protein data storage from its roots in 1971 to the present, we unveil the transformative evolution of the Protein Data Bank (PDB). From the archaic legacy PDB format, designed for punched cards, to the contemporary PDBx/mmCIF format, tailored for intricate macromolecular data, the PDB stands as a cornerstone in structural biology.
Delving into its complexities, we witness the legacy PDB’s fascinating constraints on punched cards and the emergence of the versatile mmCIF format. The PDB’s profound impact is evident, with over 1 million journal articles influenced by its extensive 1 TB database, solidifying its pivotal role in advancing scientific understanding.
Related Posts

ChimeraX Command Line Interface (CLI)
Discover the capabilities of ChimeraX’s Command Line Interface (CLI) for seamless control of its numerous functions. Gain proficiency in accessing the CLI, browsing through command history, and harnessing the flexible “open” command for handling both local and online data.
Read more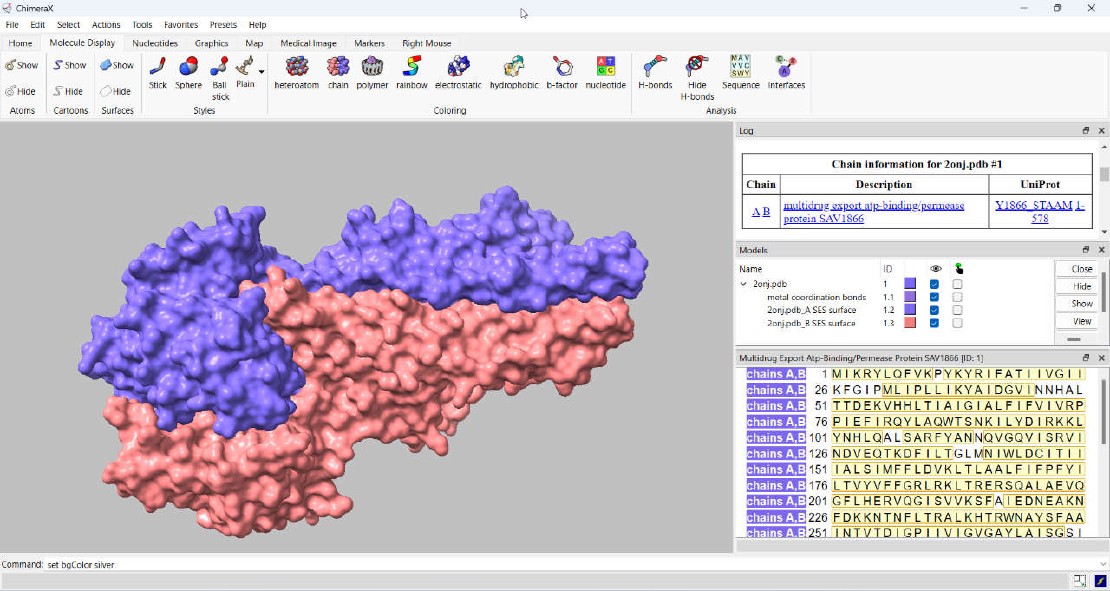
An Introduction to ChimeraX User Interface
Welcome to our blog post on ChimeraX User Interface. ChimeraX is a powerful molecular visualization and analysis software widely used by researchers in the field of structural biology.
Read more
An Introduction to Molecular Graphics
Explore the captivating world of molecular graphics, where science meets art to unravel the secrets of molecules. From the early days of wooden models to the digital age, this journey delves into the history, diverse visualization techniques, and the intricate representations of atoms, proteins, surfaces, and nucleic acids.
Read more